
Page 7 - Lesson note-3-Ch 14 Statistics Graphical Representation
P. 7
So the minimum class size is 2
We know that
Adjusted frequency = Minimum class size ×Frequency
Original Class size
On further calculation we get
2 × 6 = 4
3
2
× 30 = 30
2
2
× 44 = 44
2
2 × 16 = 8
2
2
× 4 = 1
8
So the adjusted frequency table is given below:
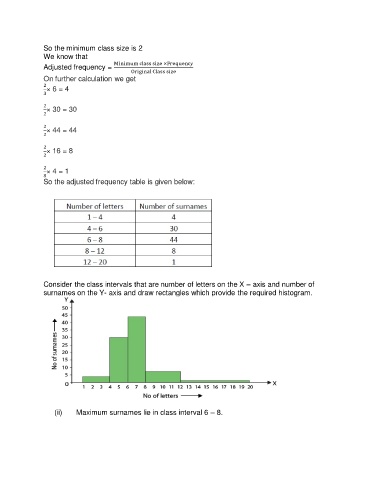
Consider the class intervals that are number of letters on the X – axis and number of
surnames on the Y- axis and draw rectangles which provide the required histogram.
(ii) Maximum surnames lie in class interval 6 – 8.