
Page 6 - Lesson note-3-Ch 14 Statistics Graphical Representation
P. 6
420-460 12
460-500 2
500-540 7
540-580 4
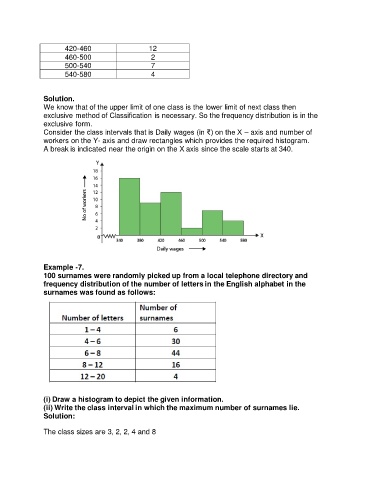
Solution.
We know that of the upper limit of one class is the lower limit of next class then
exclusive method of Classification is necessary. So the frequency distribution is in the
exclusive form.
Consider the class intervals that is Daily wages (in ₹) on the X – axis and number of
workers on the Y- axis and draw rectangles which provides the required histogram.
A break is indicated near the origin on the X axis since the scale starts at 340.
Example -7.
100 surnames were randomly picked up from a local telephone directory and
frequency distribution of the number of letters in the English alphabet in the
surnames was found as follows:
(i) Draw a histogram to depict the given information.
(ii) Write the class interval in which the maximum number of surnames lie.
Solution:
The class sizes are 3, 2, 2, 4 and 8