
Page 8 - Lesson note-3-Ch 14 Statistics Graphical Representation
P. 8
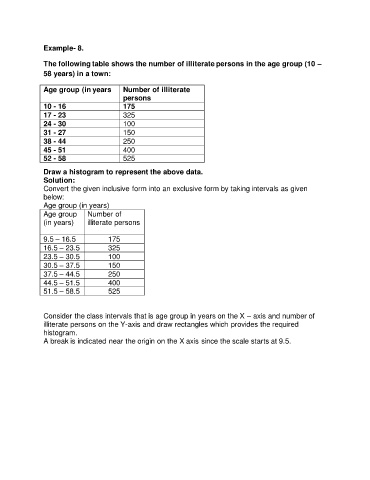
Example- 8.

               The following table shows the number of illiterate persons in the age group (10 –
               58 years) in a town:


               Age group (in years        Number of illiterate
                                          persons
               10 - 16                    175
               17 - 23                    325
               24 - 30                    100
               31 - 27                    150
               38 - 44                    250
               45 - 51                    400
               52 - 58                    525

               Draw a histogram to represent the above data.
               Solution:
               Convert the given inclusive form into an exclusive form by taking intervals as given
               below:
               Age group (in years)
               Age group      Number of
               (in years)     illiterate persons

               9.5 – 16.5            175
               16.5 – 23.5           325
               23.5 – 30.5           100
               30.5 – 37.5           150
               37.5 – 44.5           250
               44.5 – 51.5           400
               51.5 – 58.5           525


               Consider the class intervals that is age group in years on the X – axis and number of
               illiterate persons on the Y-axis and draw rectangles which provides the required
               histogram.
               A break is indicated near the origin on the X axis since the scale starts at 9.5.