
Page 3 - Lesson note-3-Ch 14 Statistics Graphical Representation
P. 3
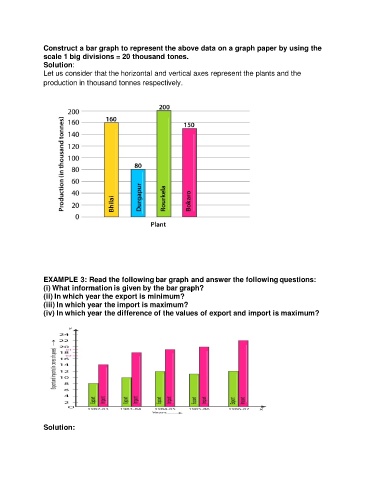
Construct a bar graph to represent the above data on a graph paper by using the
               scale 1 big divisions = 20 thousand tones.
               Solution:
               Let us consider that the horizontal and vertical axes represent the plants and the
               production in thousand tonnes respectively.


               EXAMPLE 3: Read the following bar graph and answer the following questions:
               (i) What information is given by the bar graph?
               (ii) In which year the export is minimum?
               (iii) In which year the import is maximum?
               (iv) In which year the difference of the values of export and import is maximum?


               Solution: