
Page 5 - Lesson note-3-Ch 14 Statistics Graphical Representation
P. 5
Histogram
This is a form of representation like the bar graph, but it is used for continuous class
intervals.
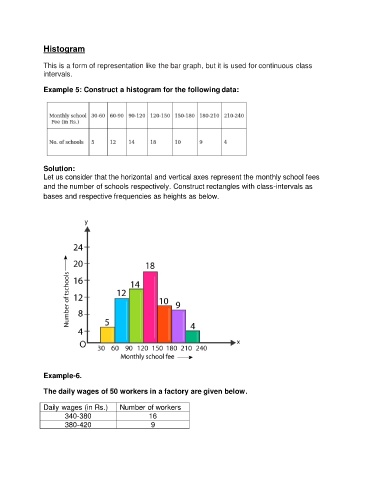
Example 5: Construct a histogram for the following data:
Solution:
Let us consider that the horizontal and vertical axes represent the monthly school fees
and the number of schools respectively. Construct rectangles with class-intervals as
bases and respective frequencies as heights as below.
Example-6.
The daily wages of 50 workers in a factory are given below.
Daily wages (in Rs.) Number of workers
340-380 16
380-420 9