
Page 4 - Lesson note-3-Ch 14 Statistics Graphical Representation
P. 4
(i) The bar graph represents the import and export (in 100 Crores of rupees)
from 1982-83 to 1986-87.
(ii) 1982-83
(iii) 1986-87
(iv) 1986-87
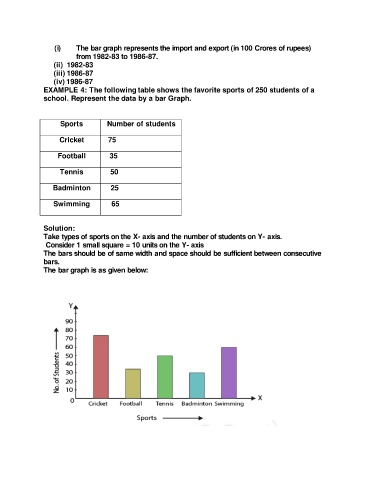
EXAMPLE 4: The following table shows the favorite sports of 250 students of a
school. Represent the data by a bar Graph.
Sports Number of students
Cricket 75
Football 35
Tennis 50
Badminton 25
Swimming 65
Solution:
Take types of sports on the X- axis and the number of students on Y- axis.
Consider 1 small square = 10 units on the Y- axis
The bars should be of same width and space should be sufficient between consecutive
bars.
The bar graph is as given below: