
Page 2 - Lesson note-3-Ch 14 Statistics Graphical Representation
P. 2
EXAMPLE 1.
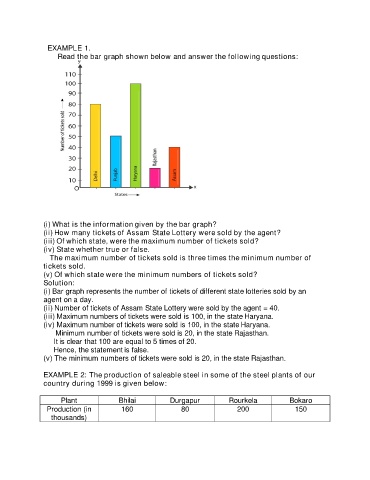
Read the bar graph shown below and answer the following questions:
(i) What is the information given by the bar graph?
(ii) How many tickets of Assam State Lottery were sold by the agent?
(iii) Of which state, were the maximum number of tickets sold?
(iv) State whether true or false.
The maximum number of tickets sold is three times the minimum number of
tickets sold.
(v) Of which state were the minimum numbers of tickets sold?
Solution:
(i) Bar graph represents the number of tickets of different state lotteries sold by an
agent on a day.
(ii) Number of tickets of Assam State Lottery were sold by the agent = 40.
(iii) Maximum numbers of tickets were sold is 100, in the state Haryana.
(iv) Maximum number of tickets were sold is 100, in the state Haryana.
Minimum number of tickets were sold is 20, in the state Rajasthan.
It is clear that 100 are equal to 5 times of 20.
Hence, the statement is false.
(v) The minimum numbers of tickets were sold is 20, in the state Rajasthan.
EXAMPLE 2: The production of saleable steel in some of the steel plants of our
country during 1999 is given below:
Plant Bhilai Durgapur Rourkela Bokaro
Production (in 160 80 200 150
thousands)