
Page 6 - Lesson note-4- Ch 14 Statistics( Frequency Polygon)
P. 6
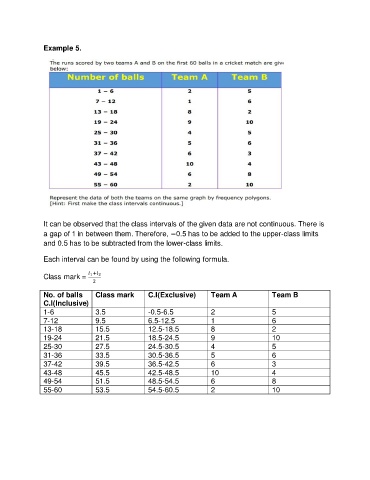
Example 5.


               It can be observed that the class intervals of the given data are not continuous. There is
               a gap of 1 in between them. Therefore, =0.5 has to be added to the upper-class limits
               and 0.5 has to be subtracted from the lower-class limits.


               Each interval can be found by using the following formula.

               Class mark =      1 +   2
                                2
               No. of balls      Class mark       C.I(Exclusive)       Team A              Team B
               C.I(Inclusive)
               1-6               3.5              -0.5-6.5             2                   5
               7-12              9.5              6.5-12.5             1                   6
               13-18             15.5             12.5-18.5            8                   2
               19-24             21.5             18.5-24.5            9                   10
               25-30             27.5             24.5-30.5            4                   5
               31-36             33.5             30.5-36.5            5                   6
               37-42             39.5             36.5-42.5            6                   3
               43-48             45.5             42.5-48.5            10                  4
               49-54             51.5             48.5-54.5            6                   8
               55-60             53.5             54.5-60.5            2                   10