
Page 3 - Lesson note-4- Ch 14 Statistics( Frequency Polygon)
P. 3
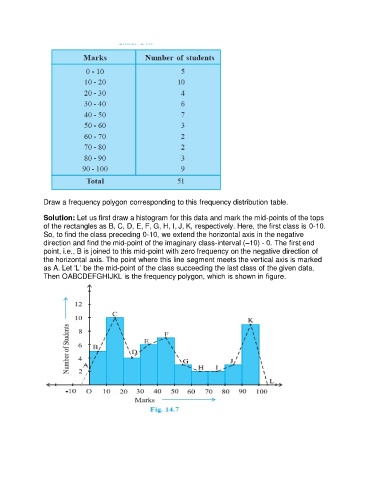
Draw a frequency polygon corresponding to this frequency distribution table.

               Solution: Let us first draw a histogram for this data and mark the mid-points of the tops
               of the rectangles as B, C, D, E, F, G, H, I, J, K, respectively. Here, the first class is 0-10.
               So, to find the class preceding 0-10, we extend the horizontal axis in the negative
               direction and find the mid-point of the imaginary class-interval (–10) - 0. The first end
               point, i.e., B is joined to this mid-point with zero frequency on the negative direction of
               the horizontal axis. The point where this line segment meets the vertical axis is marked
               as A. Let ‘L’ be the mid-point of the class succeeding the last class of the given data.
               Then OABCDEFGHIJKL is the frequency polygon, which is shown in figure.