Page 5 - Lesson note-4- Ch 14 Statistics( Frequency Polygon)
P. 5

Example4:
               Draw a frequency polygon for the following frequency distribution:


                   Class        Frequency
                  interval
                    1-10             8
                   11-20             3
                   21-30             6
                   31-40            12
                   41-50             2
                   51-60             7
               Solution:


               Convert the given inclusive form into an exclusive form by taking intervals as 0.5 – 1.5,
               10.5 – 20.5, 20.5 – 30.5, 40.5 – 40.5, 40.5 – 50.5 and 50.5 – 60.5
               We know that
               Class mark of a class interval = (lower limit + upper limit)/ 2

                Class interval      True class limit       Class mark        Frequency
                     (-9) -0           (-9.5) - 0.5            -4.5                0
                     1  -10            0.5 - 10.5              5.5                 8
                     11 -20            10.5-20.5               15.5                3
                     21 -30            20.5-30.5               25.5                6
                     31 -40            30.5-40.5               35.5               12
                     41 -50            40.5-50.5               45.5                2
                     51 -60            50.5-60.5               55.5                7
                     61 -70            60.5-70.5               65.5                0
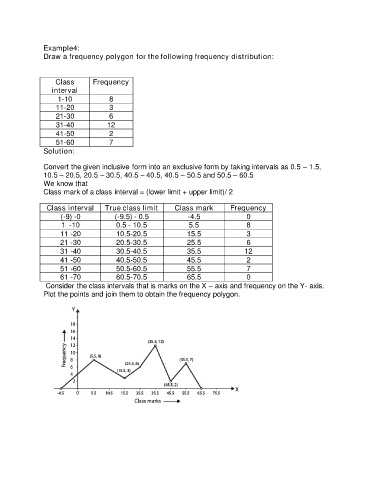
                Consider the class intervals that is marks on the X – axis and frequency on the Y- axis.
               Plot the points and join them to obtain the frequency polygon.
   1   2   3   4   5   6   7