Page 4 - Lesson note-4- Ch 14 Statistics( Frequency Polygon)
P. 4

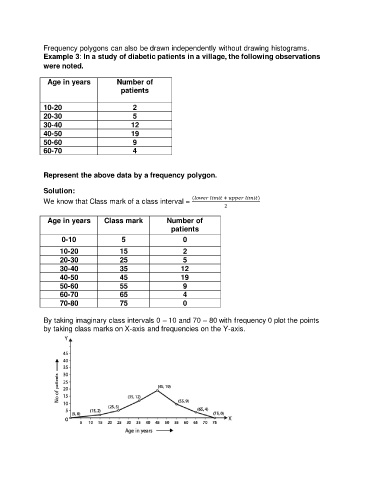
Frequency polygons can also be drawn independently without drawing histograms.
               Example 3: In a study of diabetic patients in a village, the following observations
               were noted.

                 Age in years           Number of
                                         patients

               10-20                         2
               20-30                         5
               30-40                        12
               40-50                        19
               50-60                         9
               60-70                         4


               Represent the above data by a frequency polygon.

               Solution:

               We know that Class mark of a class interval =     (                      +                      )
                                                                           2

                 Age in years      Class mark           Number of
                                                          patients
                     0-10                5                    0

                     10-20               15                   2
                     20-30               25                   5
                     30-40               35                  12
                     40-50               45                  19
                     50-60               55                   9
                     60-70               65                   4
                     70-80               75                   0

               By taking imaginary class intervals 0 – 10 and 70 – 80 with frequency 0 plot the points
               by taking class marks on X-axis and frequencies on the Y-axis.
   1   2   3   4   5   6   7