
Page 2 - Lesson note-4- Ch 14 Statistics( Frequency Polygon)
P. 2
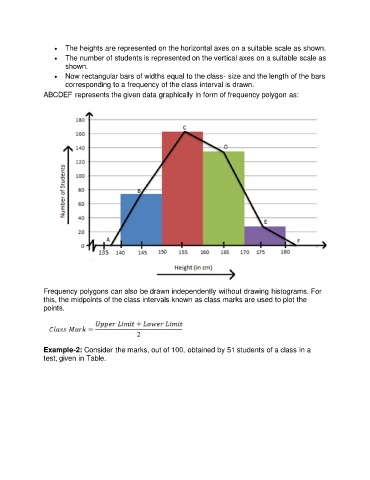
•  The heights are represented on the horizontal axes on a suitable scale as shown.
                   •  The number of students is represented on the vertical axes on a suitable scale as
                       shown.
                   •  Now rectangular bars of widths equal to the class- size and the length of the bars
                       corresponding to a frequency of the class interval is drawn.
               ABCDEF represents the given data graphically in form of frequency polygon as:


               Frequency polygons can also be drawn independently without drawing histograms. For
               this, the midpoints of the class intervals known as class marks are used to plot the
               points.


               Example-2: Consider the marks, out of 100, obtained by 51 students of a class in a
               test, given in Table.