
Page 7 - Lesson note- 2- Ch 14 Statistics (Frequency Distribution)
P. 7
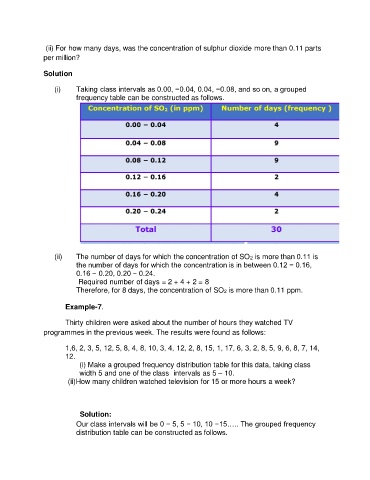
(ii) For how many days, was the concentration of sulphur dioxide more than 0.11 parts
               per million?

               Solution


                   (i)    Taking class intervals as 0.00, −0.04, 0.04, −0.08, and so on, a grouped
                          frequency table can be constructed as follows.


                   (ii)   The number of days for which the concentration of SO2 is more than 0.11 is
                          the number of days for which the concentration is in between 0.12 − 0.16,
                          0.16 − 0.20, 0.20 − 0.24.
                           Required number of days = 2 + 4 + 2 = 8
                          Therefore, for 8 days, the concentration of SO2 is more than 0.11 ppm.

                       Example-7.


                       Thirty children were asked about the number of hours they watched TV
               programmes in the previous week. The results were found as follows:

                       1,6, 2, 3, 5, 12, 5, 8, 4, 8, 10, 3, 4, 12, 2, 8, 15, 1, 17, 6, 3, 2, 8, 5, 9, 6, 8, 7, 14,
                       12.
                           (i) Make a grouped frequency distribution table for this data, taking class
                           width 5 and one of the class  intervals as 5 – 10.
                           (ii)How many children watched television for 15 or more hours a week?


                                 Solution:
                          Our class intervals will be 0 − 5, 5 − 10, 10 −15….. The grouped frequency
                          distribution table can be constructed as follows.