
Page 3 - Lesson note- 2- Ch 14 Statistics (Frequency Distribution)
P. 3
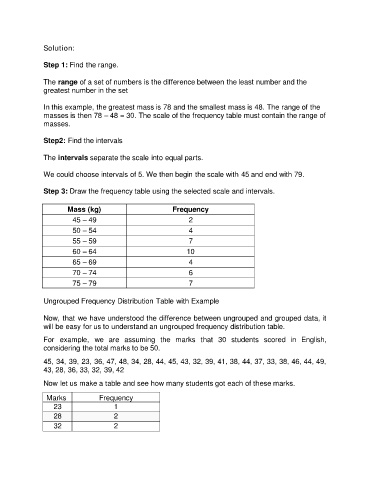
Solution:

               Step 1: Find the range.


               The range of a set of numbers is the difference between the least number and the
               greatest number in the set

               In this example, the greatest mass is 78 and the smallest mass is 48. The range of the
               masses is then 78 – 48 = 30. The scale of the frequency table must contain the range of
               masses.

               Step2: Find the intervals


               The intervals separate the scale into equal parts.

               We could choose intervals of 5. We then begin the scale with 45 and end with 79.


               Step 3: Draw the frequency table using the selected scale and intervals.

                       Mass (kg)                          Frequency
                         45 – 49                               2

                         50 – 54                               4
                         55 – 59                               7
                         60 – 64                               10
                         65 – 69                               4
                         70 – 74                               6

                         75 – 79                               7

               Ungrouped Frequency Distribution Table with Example


               Now, that we have understood the difference between ungrouped and grouped data, it
               will be easy for us to understand an ungrouped frequency distribution table.

               For  example,  we  are  assuming  the  marks  that  30  students  scored  in  English,
               considering the total marks to be 50.

               45, 34, 39, 23, 36, 47, 48, 34, 28, 44, 45, 43, 32, 39, 41, 38, 44, 37, 33, 38, 46, 44, 49,
               43, 28, 36, 33, 32, 39, 42

               Now let us make a table and see how many students got each of these marks.

                Marks             Frequency
                   23                  1
                   28                  2
                   32                  2