
Page 2 - Lesson note- 2- Ch 14 Statistics (Frequency Distribution)
P. 2
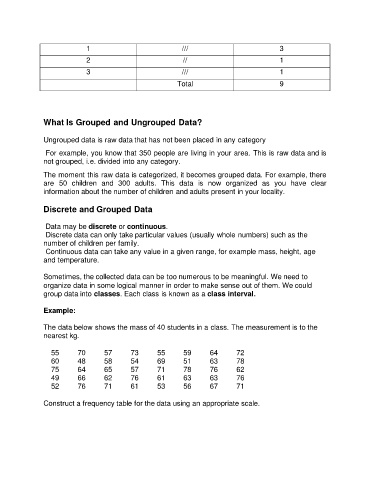
1                              ///                             3

                              2                               //                             1
                              3                              ///                             1
                                                            Total                            9


               What Is Grouped and Ungrouped Data?


               Ungrouped data is raw data that has not been placed in any category

                For example, you know that 350 people are living in your area. This is raw data and is
               not grouped, i.e. divided into any category.

               The moment this raw data is categorized, it becomes grouped data. For example, there
               are  50  children  and  300  adults.  This  data  is  now  organized  as  you  have  clear
               information about the number of children and adults present in your locality.

               Discrete and Grouped Data


                Data may be discrete or continuous.
                Discrete data can only take particular values (usually whole numbers) such as the
               number of children per family.
                Continuous data can take any value in a given range, for example mass, height, age
               and temperature.

               Sometimes, the collected data can be too numerous to be meaningful. We need to
               organize data in some logical manner in order to make sense out of them. We could
               group data into classes. Each class is known as a class interval.

               Example:


               The data below shows the mass of 40 students in a class. The measurement is to the
               nearest kg.


                  55       70      57       73       55       59      64       72
                  60       48      58       54       69       51      63       78
                  75       64      65       57       71       78      76       62
                  49       66      62       76       61       63      63       76
                  52       76      71       61       53       56      67       71

               Construct a frequency table for the data using an appropriate scale.