
Page 6 - Lesson note- 2- Ch 14 Statistics (Frequency Distribution)
P. 6
(i) Construct a grouped frequency distribution table with classes 84 - 86, 86 – 88
etc.
(ii) Which month or season do you think this data is about?
(iii) What is the range of this data?
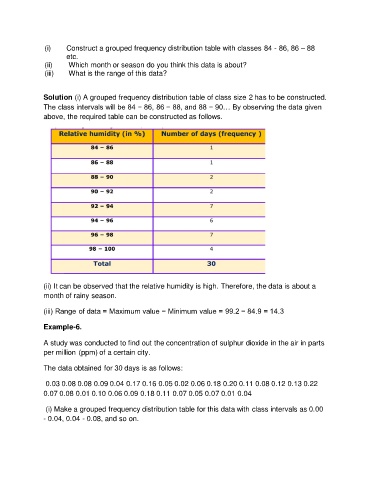
Solution (i) A grouped frequency distribution table of class size 2 has to be constructed.
The class intervals will be 84 − 86, 86 − 88, and 88 − 90… By observing the data given
above, the required table can be constructed as follows.
(ii) It can be observed that the relative humidity is high. Therefore, the data is about a
month of rainy season.
(iii) Range of data = Maximum value − Minimum value = 99.2 − 84.9 = 14.3
Example-6.
A study was conducted to find out the concentration of sulphur dioxide in the air in parts
per million (ppm) of a certain city.
The data obtained for 30 days is as follows:
0.03 0.08 0.08 0.09 0.04 0.17 0.16 0.05 0.02 0.06 0.18 0.20 0.11 0.08 0.12 0.13 0.22
0.07 0.08 0.01 0.10 0.06 0.09 0.18 0.11 0.07 0.05 0.07 0.01 0.04
(i) Make a grouped frequency distribution table for this data with class intervals as 0.00
- 0.04, 0.04 - 0.08, and so on.