
Page 5 - Lesson note- 2- Ch 14 Statistics (Frequency Distribution)
P. 5
2-4 17
4-6 9
6-8 3
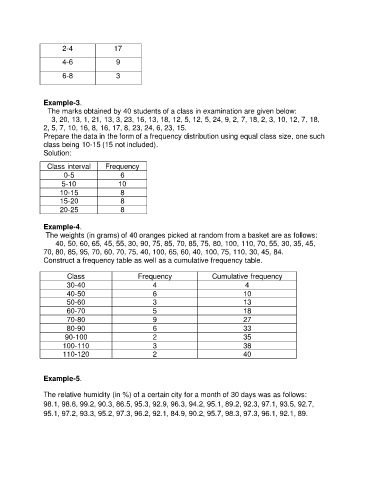
Example-3.
The marks obtained by 40 students of a class in examination are given below:
3, 20, 13, 1, 21, 13, 3, 23, 16, 13, 18, 12, 5, 12, 5, 24, 9, 2, 7, 18, 2, 3, 10, 12, 7, 18,
2, 5, 7, 10, 16, 8, 16, 17, 8, 23, 24, 6, 23, 15.
Prepare the data in the form of a frequency distribution using equal class size, one such
class being 10-15 (15 not included).
Solution:
Class interval Frequency
0-5 6
5-10 10
10-15 8
15-20 8
20-25 8
Example-4.
The weights (in grams) of 40 oranges picked at random from a basket are as follows:
40, 50, 60, 65, 45, 55, 30, 90, 75, 85, 70, 85, 75, 80, 100, 110, 70, 55, 30, 35, 45,
70, 80, 85, 95, 70, 60, 70, 75, 40, 100, 65, 60, 40, 100, 75, 110, 30, 45, 84.
Construct a frequency table as well as a cumulative frequency table.
Class Frequency Cumulative frequency
30-40 4 4
40-50 6 10
50-60 3 13
60-70 5 18
70-80 9 27
80-90 6 33
90-100 2 35
100-110 3 38
110-120 2 40
Example-5.
The relative humidity (in %) of a certain city for a month of 30 days was as follows:
98.1, 98.6, 99.2, 90.3, 86.5, 95.3, 92.9, 96.3, 94.2, 95.1, 89.2, 92.3, 97.1, 93.5, 92.7,
95.1, 97.2, 93.3, 95.2, 97.3, 96.2, 92.1, 84.9, 90.2, 95.7, 98.3, 97.3, 96.1, 92.1, 89.