
Page 1 - Lesson note- 2- Ch 14 Statistics (Frequency Distribution)
P. 1
SAI International Residential School
Class –IX
Mathematics
Chapter-14: statistics
LESSON NOTES -2
Sub topics: Frequency distribution table
Ungrouped frequency distribution table and Grouped frequency
distribution table.
Frequency Distribution Tables
Do you ever get tired of having the same thing for lunch? Have you ever wondered how
many days in a month you eat a sandwich for lunch?
A frequency distribution table can help you organize this data to find out.
A frequency distribution table is a chart that summarizes values and their frequency.
It's a useful way to organize data if you have a list of numbers that represent the
frequency of a certain outcome in a sample.
A frequency distribution table has two columns. The first column lists all the various
outcomes that occur in the data, and the second column lists the frequency of each
outcome.
Using Frequency Distribution Tables
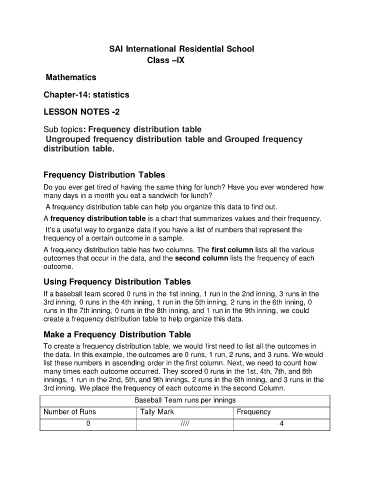
If a baseball team scored 0 runs in the 1st inning, 1 run in the 2nd inning, 3 runs in the
3rd inning, 0 runs in the 4th inning, 1 run in the 5th inning, 2 runs in the 6th inning, 0
runs in the 7th inning, 0 runs in the 8th inning, and 1 run in the 9th inning, we could
create a frequency distribution table to help organize this data.
Make a Frequency Distribution Table
To create a frequency distribution table, we would first need to list all the outcomes in
the data. In this example, the outcomes are 0 runs, 1 run, 2 runs, and 3 runs. We would
list these numbers in ascending order in the first column. Next, we need to count how
many times each outcome occurred. They scored 0 runs in the 1st, 4th, 7th, and 8th
innings, 1 run in the 2nd, 5th, and 9th innings, 2 runs in the 6th inning, and 3 runs in the
3rd inning. We place the frequency of each outcome in the second Column.
Baseball Team runs per innings
Number of Runs Tally Mark Frequency
0 //// 4