
Page 5 - LN
P. 5
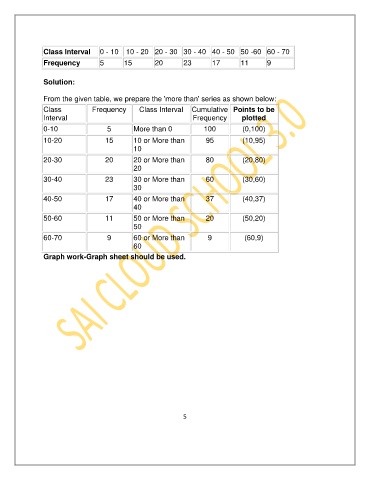
Class Interval     0 - 10   10 - 20  20 - 30  30 - 40  40 - 50  50 -60  60 - 70
               Frequency          5       15        20        23       17        11      9


               Solution:


               From the given table, we prepare the 'more than' series as shown below:
               Class           Frequency       Class Interval  Cumulative  Points to be
               Interval                                          Frequency       plotted
               0-10                 5        More than 0            100          (0,100)
               10-20                15       10 or More than         95          (10,95)
                                             10
               20-30                20       20 or More than         80          (20,80)
                                             20
               30-40                23       30 or More than         60          (30,60)
                                             30
               40-50                17       40 or More than         37          (40,37)
                                             40
               50-60                11       50 or More than         20          (50,20)
                                             50
               60-70                9        60 or More than          9           (60,9)
                                             60
               Graph work-Graph sheet should be used.


                                                              5