
Page 1 - LN
P. 1
SAI International School
CLASS - X
Mathematics
CHAPTER-14: Statistics-4Lesson Notes-4
SUBTOPIC : Graphical Representation of Cum.Freq.Distribution
Graphical Representation of Cumulative Frequency Distribution.
*Cumulative Frequency Curve or an Ogive Curve.
An Ogive is a shape consisting of a concave arc flowing into a convex arcs. So forming
an S-shaped curve with vertical ends.
Graphical representation of cumulative frequency distribution is of two types
1.Less than type Ogive
2.More than type Ogive
*Less Than Type Ogive
It is the graph drawn between the upper limits and cumulative frequencies of a
distribution.
a)Here we mark the points with upper limit as x-coordinate and corresponding
cumulative frequency as y-co-ordinate and join them by a free hand smooth curve.
b)This type of graph is cumulated upward.
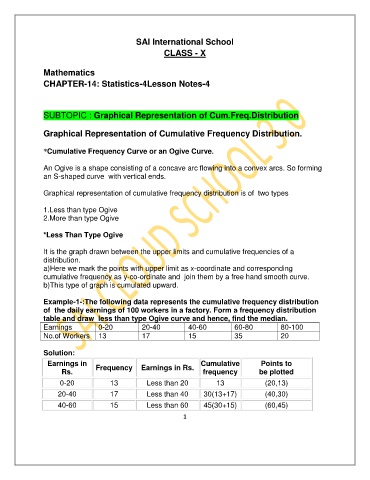
Example-1-:The following data represents the cumulative frequency distribution
of the daily earnings of 100 workers in a factory. Form a frequency distribution
table and draw less than type Ogive curve and hence, find the median.
Earnings 0-20 20-40 40-60 60-80 80-100
No.of Workers 13 17 15 35 20
Solution:
Earnings in Frequency Earnings in Rs. Cumulative Points to
Rs. frequency be plotted
0-20 13 Less than 20 13 (20,13)
20-40 17 Less than 40 30(13+17) (40,30)
40-60 15 Less than 60 45(30+15) (60,45)
1