
Page 3 - LN
P. 3
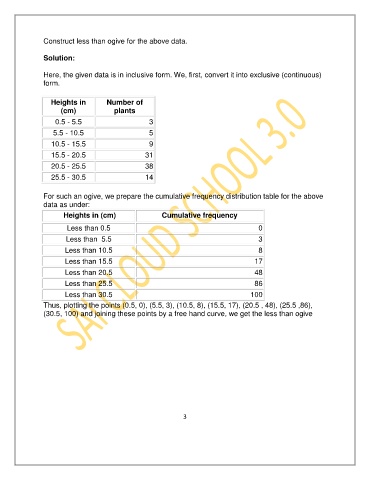
Construct less than ogive for the above data.

               Solution:


               Here, the given data is in inclusive form. We, first, convert it into exclusive (continuous)
               form.


                  Heights in        Number of
                     (cm)              plants
                   0.5 - 5.5                      3
                   5.5 - 10.5                     5

                  10.5 - 15.5                     9
                  15.5 - 20.5                    31
                  20.5 - 25.5                    38

                  25.5 - 30.5                    14

               For such an ogive, we prepare the cumulative frequency distribution table for the above
               data as under:

                      Heights in (cm)                  Cumulative frequency
                       Less than 0.5                                                   0
                       Less than  5.5                                                  3

                       Less than 10.5                                                  8
                       Less than 15.5                                                17
                       Less than 20.5                                                48

                       Less than 25.5                                                86
                       Less than 30.5                                               100
               Thus, plotting the points (0.5, 0), (5.5, 3), (10.5, 8), (15.5, 17), (20.5 , 48), (25.5 ,86),
               (30.5, 100) and joining these points by a free hand curve, we get the less than ogive


                                                              3