
Page 2 - LN
P. 2
60-80 35 Less than 80 80(45+35) (80,80)
80-100 20 Less than 100 100(80+20) (100,100)
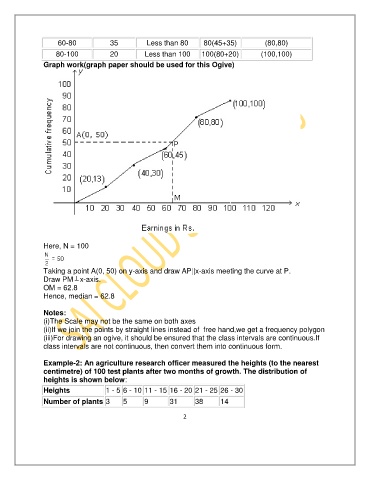
Graph work(graph paper should be used for this Ogive)
Here, N = 100
Taking a point A(0, 50) on y-axis and draw AP||x-axis meeting the curve at P.
Draw PM x-axis.
OM = 62.8
Hence, median = 62.8
Notes:
(i)The Scale may not be the same on both axes
(ii)If we join the points by straight lines instead of free hand,we get a frequency polygon
(iii)For drawing an ogive, it should be ensured that the class intervals are continuous.If
class intervals are not continuous, then convert them into continuous form.
Example-2: An agriculture research officer measured the heights (to the nearest
centimetre) of 100 test plants after two months of growth. The distribution of
heights is shown below:
Heights 1 - 5 6 - 10 11 - 15 16 - 20 21 - 25 26 - 30
Number of plants 3 5 9 31 38 14
2