
Page 4 - CLASS VII Lesson Notes Forces and Energy
P. 4
SUBTOPIC: 3.3 Describing Movement
Key Words: distance–time, graphs, sketch, at rest, stationary, safety precautions
Understanding Distance–Time Graphs
• Scientists often use graphs to show how movement happens over time.
• A distance–time graph shows how far an object has travelled from the starting point as time passes.
• On these graphs:
Ø Distance is on the vertical (y) axis
Ø Time is on the horizontal (x) axis
What Distance–Time Graphs Show
1. Constant Speed Away from Start
Ø The object moves the same distance every second.
Ø The line is straight and slopes upwards.
Ø A steeper line means the object is moving faster.
2. Stationary (Not Moving)
Ø The object has stopped
moving.
Ø The line is flat and
horizontal.
Ø Distance does not change,
but time keeps passing.
3. Moving Faster
Ø If the object speeds up, the
line gets steeper.
Ø It shows a greater distance
travelled in each second.
4. Returning to Start
Ø The object moves back towards the starting point.
Ø The line slopes downwards.
Ø Distance from the start is decreasing over time.
Using a Distance–Time Graph
• You can read values of distance and time from the axes.
• You can calculate speed from the graph using:
• Speed= !"#$%&'( '*+(,(-
0".( $%/(&
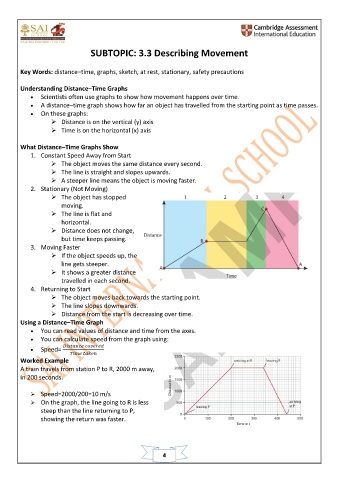
Worked Example
A train travels from station P to R, 2000 m away,
in 200 seconds.
Ø Speed=2000/200=10 m/s
Ø On the graph, the line going to R is less
steep than the line returning to P,
showing the return was faster.
4