Page 7 - Home Assignment-Price determination
P. 7

  In the above diagram the equilibrium price ‘OP’ and quantity ‘OQ’

                              is determined at point ‘E’ where market demand = market supply.
                            Due to increase in supply the supply curve shifts right ward to
                               |
                                 resulting an excess supply situation in the market by EF.
                            In order to overcome the excess supply situation, the price level
                                                                                            |
                              will fall, it will lead to contraction in supply from F to     and
                                                                    |
                              expansion in demand from E to    .
                                                                               |
                             Finally, the equilibrium price will fall to       and quantity will
                                               |
                              increase to       respectively.
               Special cases: -

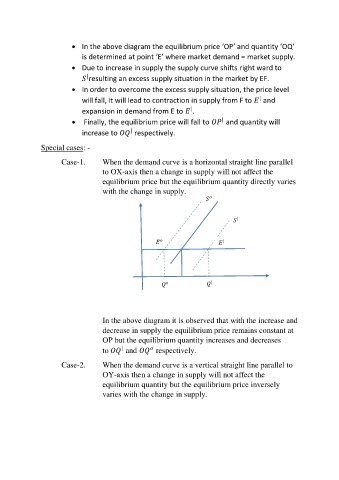
                       Case-1.       When the demand curve is a horizontal straight line parallel

                                     to OX-axis then a change in supply will not affect the
                                     equilibrium price but the equilibrium quantity directly varies
                                     with the change in supply.
                                                                             
                                                                                S
                                                     Y
                                                                                     
                                                                                    |
                                              Pri
                                              ce
                                                           
                                                                               |
                                                                      E         
                                               P                                         D

                                                                                                 X

                                                                           |
                                                             
                                                O               Q                Quantity demanded
                                                                                and quantity supplied


                                     In the above diagram it is observed that with the increase and
                                     decrease in supply the equilibrium price remains constant at

                                     OP but the equilibrium quantity increases and decreases
                                            |
                                                        
                                     to       and       respectively.
                       Case-2.       When the demand curve is a vertical straight line parallel to
                                     OY-axis then a change in supply will not affect the
                                     equilibrium quantity but the equilibrium price inversely

                                     varies with the change in supply.
   2   3   4   5   6   7   8