
Page 6 - Home Assignment-Price determination
P. 6
Y |
Pri S
|
ce
|
E
F
P
D
X
|
O Q Quantity demanded
and quantity supplied
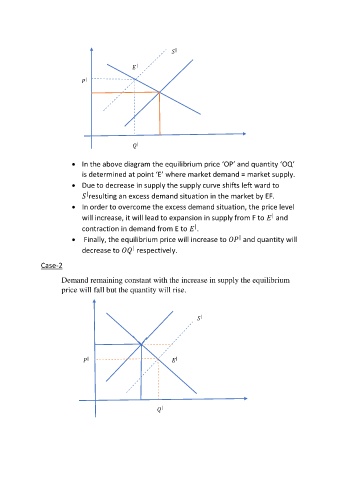
In the above diagram the equilibrium price ‘OP’ and quantity ‘OQ’
is determined at point ‘E’ where market demand = market supply.
Due to decrease in supply the supply curve shifts left ward to
|
resulting an excess demand situation in the market by EF.
In order to overcome the excess demand situation, the price level
|
will increase, it will lead to expansion in supply from F to and
|
contraction in demand from E to .
|
Finally, the equilibrium price will increase to and quantity will
|
decrease to respectively.
Case-2
Demand remaining constant with the increase in supply the equilibrium
price will fall but the quantity will rise.
Y
S
Pri
|
ce
E F
P
|
|
D
X
|
O Q Quantity demanded
and quantity supplied