
Page 4 - MM
P. 4
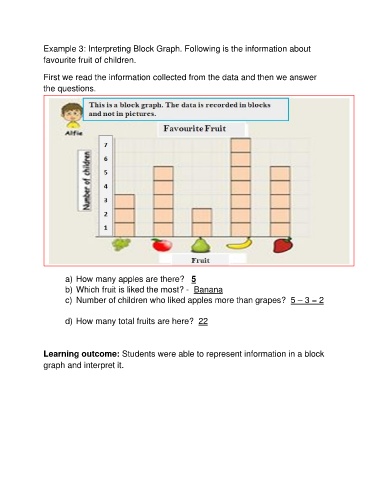
Example 3: Interpreting Block Graph. Following is the information about
               favourite fruit of children.


               First we read the information collected from the data and then we answer

               the questions.


                       a) How many apples are there?   5

                       b) Which fruit is liked the most? -  Banana
                       c)  Number of children who liked apples more than grapes?  5 – 3 = 2

                       d) How many total fruits are here?  22


               Learning outcome: Students were able to represent information in a block
               graph and interpret it.