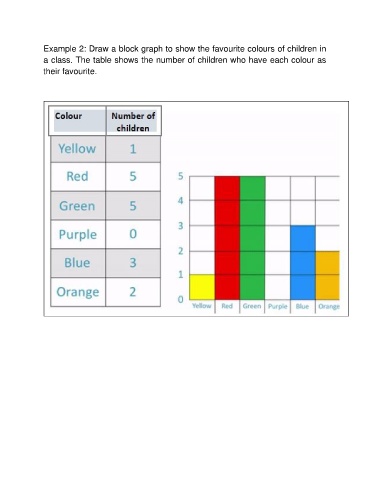
Example 2: Draw a block graph to show the favourite colours of children in
               a class. The table shows the number of children who have each colour as

               their favourite.