
Page 10 - LN
P. 10
Since, p + q =25
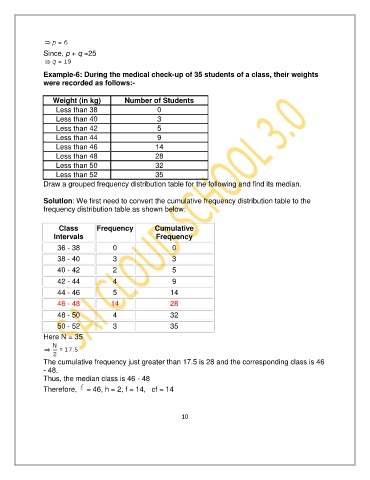
Example-6: During the medical check-up of 35 students of a class, their weights
were recorded as follows:-
Weight (in kg) Number of Students
Less than 38 0
Less than 40 3
Less than 42 5
Less than 44 9
Less than 46 14
Less than 48 28
Less than 50 32
Less than 52 35
Draw a grouped frequency distribution table for the following and find its median.
Solution: We first need to convert the cumulative frequency distribution table to the
frequency distribution table as shown below:
Class Frequency Cumulative
Intervals Frequency
36 - 38 0 0
38 - 40 3 3
40 - 42 2 5
42 - 44 4 9
44 - 46 5 14
46 - 48 14 28
48 - 50 4 32
50 - 52 3 35
Here N = 35
The cumulative frequency just greater than 17.5 is 28 and the corresponding class is 46
- 48.
Thus, the median class is 46 - 48
Therefore, = 46, h = 2, f = 14, cf = 14
10