
Page 3 - LN
P. 3
In grouped data, mode is a value that lies in the modal class and it is given by the
formula.
1− 0
Mode = + ℎ
2 1− 0− 2
Where l=Lower limit of the modal class
h=size of the class interval(Assuming all class sizes to be equal)
f 1=frequency of the modal class
f 0=frequency of the class preceding the modal class
f 2=frequency of the class succeeding the modal class.
Note:
Mode can also be calculated for a grouped data with unequal class sizes.
Mode can be less, equal or more than the mean of the data.
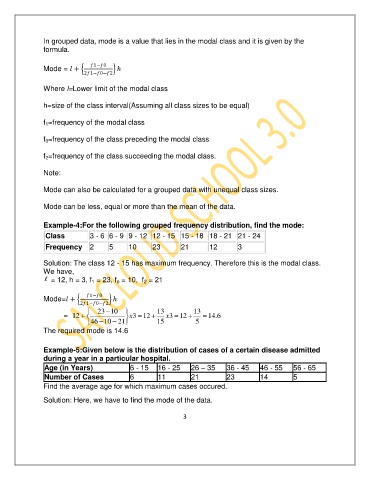
Example-4:For the following grouped frequency distribution, find the mode:
Class 3 - 6 6 - 9 9 - 12 12 - 15 15 - 18 18 - 21 21 - 24
Frequency 2 5 10 23 21 12 3
Solution: The class 12 - 15 has maximum frequency. Therefore this is the modal class.
We have,
= 12, h = 3, f 1 = 23, f o = 10, f 2 = 21
1− 0
Mode= + ℎ
2 1− 0− 2
23 10 13 13
= 12 x 3 12 x 3 12 14 6 .
46 10 21 15 5
The required mode is 14.6
Example-5:Given below is the distribution of cases of a certain disease admitted
during a year in a particular hospital.
Age (in Years) 6 - 15 16 - 25 26 – 35 36 - 45 46 - 55 56 - 65
Number of Cases 6 11 21 23 14 5
Find the average age for which maximum cases occured.
Solution: Here, we have to find the mode of the data.
3