
Page 4 - HA
P. 4
4. Use the tables below to draw linear graphs.
(a) The number of days a hill side city received snow in different years.
(b) Population (in thousands) of men and women in a village in
different years.
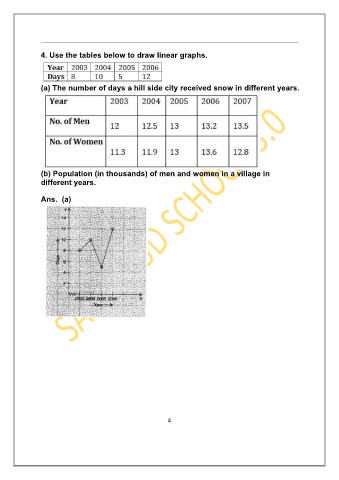
Ans. (a)
4