
Page 5 - HA
P. 5
(b)
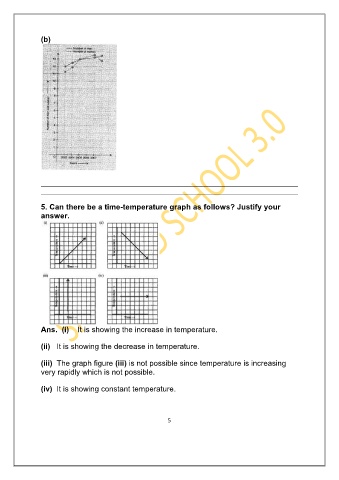
5. Can there be a time-temperature graph as follows? Justify your
answer.
Ans. (i) It is showing the increase in temperature.
(ii) It is showing the decrease in temperature.
(iii) The graph figure (iii) is not possible since temperature is increasing
very rapidly which is not possible.
(iv) It is showing constant temperature.
5