
Page 3 - HA
P. 3
(d) Plant B grew during end of the 2 week to the end of the 3 week
nd
rd
= 10 cm – 7 cm = 3 cm.
(e) Plant A grew the highest during second week.
(f) Plant B grew the least during first week.
(g) At the end of the second week, plant A and B were of the same height.
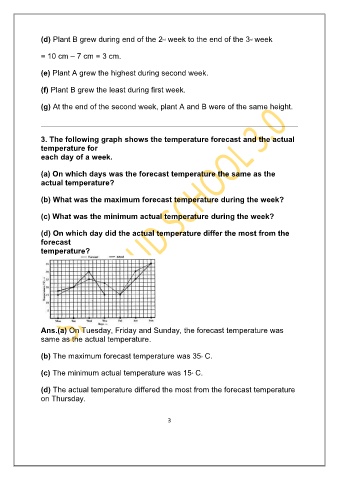
3. The following graph shows the temperature forecast and the actual
temperature for
each day of a week.
(a) On which days was the forecast temperature the same as the
actual temperature?
(b) What was the maximum forecast temperature during the week?
(c) What was the minimum actual temperature during the week?
(d) On which day did the actual temperature differ the most from the
forecast
temperature?
Ans.(a) On Tuesday, Friday and Sunday, the forecast temperature was
same as the actual temperature.
(b) The maximum forecast temperature was 35 C.
o
(c) The minimum actual temperature was 15 C.
o
(d) The actual temperature differed the most from the forecast temperature
on Thursday.
3