
Page 1 - HA
P. 1
SAI International School
CLASS - VIII
Mathematics
CHAPTER-15: Introduction to graph
HOME ASSIGNMENT
SUBTOPIC :LINE GRAPH
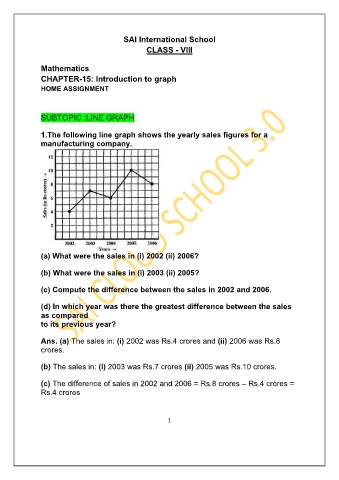
1.The following line graph shows the yearly sales figures for a
manufacturing company.
(a) What were the sales in (i) 2002 (ii) 2006?
(b) What were the sales in (i) 2003 (ii) 2005?
(c) Compute the difference between the sales in 2002 and 2006.
(d) In which year was there the greatest difference between the sales
as compared
to its previous year?
Ans. (a) The sales in: (i) 2002 was Rs.4 crores and (ii) 2006 was Rs.8
crores.
(b) The sales in: (i) 2003 was Rs.7 crores (ii) 2005 was Rs.10 crores.
(c) The difference of sales in 2002 and 2006 = Rs.8 crores – Rs.4 crores =
Rs.4 crores
1