
Page 2 - ln1
P. 2
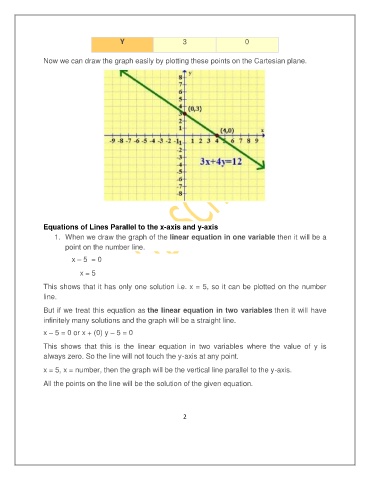
Y                    3                   0


               Now we can draw the graph easily by plotting these points on the Cartesian plane.


               Equations of Lines Parallel to the x-axis and y-axis
                   1.  When we draw the graph of the linear equation in one variable then it will be a
                       point on the number line.

                             x – 5  = 0

                                 x = 5
               This shows that it has only one solution i.e. x = 5, so it can be plotted on the  number
               line.

               But if we treat this equation as the linear equation in two variables then it will have
               infinitely many solutions and the graph will be a straight line.

               x – 5 = 0 or x + (0) y – 5 = 0

               This  shows  that  this  is  the  linear  equation  in  two  variables  where  the  value  of  y  is
               always zero. So the line will not touch the y-axis at any point.
               x = 5, x = number, then the graph will be the vertical line parallel to the y-axis.

               All the points on the line will be the solution of the given equation.


                                                              2