
Page 3 - MM
P. 3
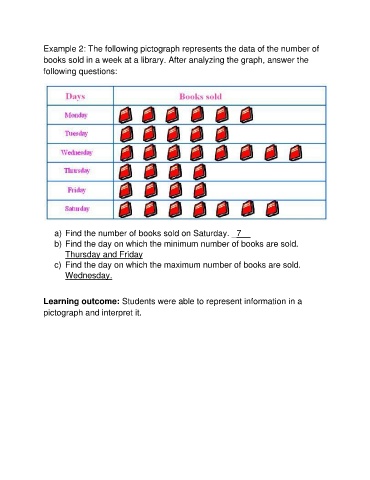
Example 2: The following pictograph represents the data of the number of
               books sold in a week at a library. After analyzing the graph, answer the

               following questions:


                   a) Find the number of books sold on Saturday. _7__
                   b) Find the day on which the minimum number of books are sold.

                       Thursday and Friday
                   c)  Find the day on which the maximum number of books are sold.
                       Wednesday.


               Learning outcome: Students were able to represent information in a

               pictograph and interpret it.