
Page 2 - MM
P. 2
Data handling using Pictograph:
Learning objective: Students will be able to represent information in
pictograph and interpret it.
• A pictograph is a way of data handling that uses pictures to display
collected information.
• It helps answer the questions on the data at a glance.
• A pictograph has:
• Pictures - They tell us the given number of objects.
• A key – It is a symbol that tells us the number each picture is equal to.
• Pictographs are often used by dailies and magazines to attract reader’s
attention.
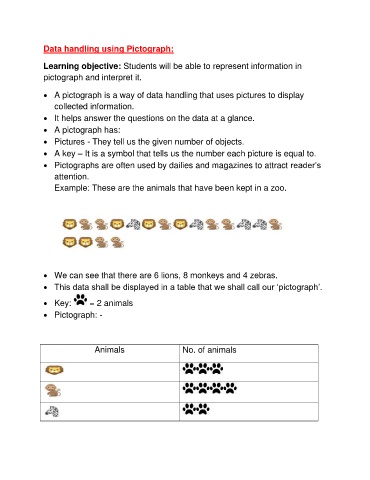
Example: These are the animals that have been kept in a zoo.
• We can see that there are 6 lions, 8 monkeys and 4 zebras.
• This data shall be displayed in a table that we shall call our ‘pictograph’.
• Key: = 2 animals
• Pictograph: -
Animals No. of animals