
Page 1 - LN
P. 1
Class XI
Subject- Economics,
Statistics
CHAPTER-7
TOPIC- Graphic Presentation
(Note - 31)
Topic -
Ogive
Time Series graph
False Base line
Ogive or Cumulative Frequency Polygon:
Ogive is a cumulative frequency graphs drawn on natural scale to
determine the values of certain factors like median, Quartile, Percentile
etc. In these graphs the exact limits of the class intervals are shown along
the X-axis and the cumulative frequencies are shown along the Y-axis.
Below are given the steps to draw an ogive.
What is a Cumulative Frequency Graph?
A Cumulative Frequency Graph is a graph plotted from a cumulative frequency table.
A cumulative frequency graph is also called an ogive or cumulative frequency curve.
The following examples show how to draw a cumulative frequency curve for grouped
data.
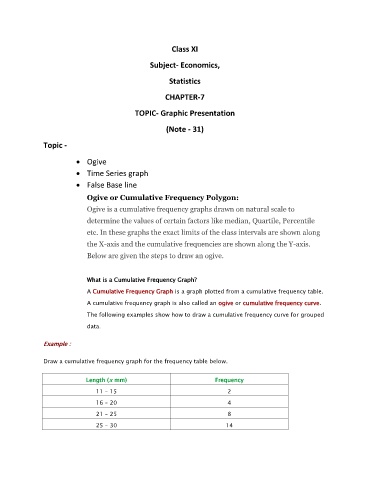
Example :
Draw a cumulative frequency graph for the frequency table below.
Length (x mm) Frequency
11 – 15 2
16 – 20 4
21 – 25 8
25 – 30 14