
Page 7 - LN
P. 7
Time Series Graphs
When the value of a variable are recorded with respect to the time
of its occurrence, then the arrangement is known as Time Series.
It is also known as Historigram ot ‘Line Graph’.
There are two variables here , Time and the Variable under study.
Can of two types; One variable graph and Two or more than two
Variables Graphs
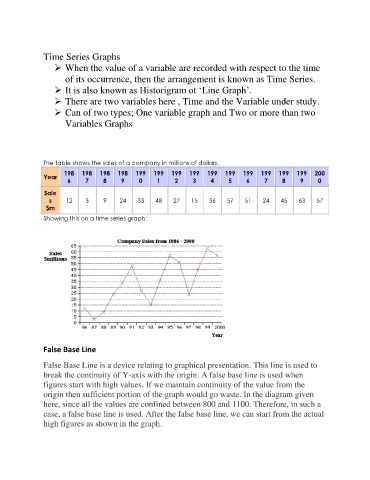
The table shows the sales of a company in millions of dollars.
198 198 198 198 199 199 199 199 199 199 199 199 199 199 200
Year
6 7 8 9 0 1 2 3 4 5 6 7 8 9 0
Sale
s 12 3 9 24 33 48 27 15 36 57 51 24 45 63 57
$m
Showing this on a time series graph:
False Base Line
False Base Line is a device relating to graphical presentation. This line is used to
break the continuity of Y-axis with the origin. A false base line is used when
figures start with high values. If we maintain continuity of the value from the
origin then sufficient portion of the graph would go waste. In the diagram given
here, since all the values are confined between 800 and 1100. Therefore, in such a
case, a false base line is used. After the false base line, we can start from the actual
high figures as shown in the graph.