
Page 2 - LN
P. 2
To make more presenting analysis
Types of Graphs
There are two types of graphs
Frequency Distribution Graphs
Time Series Graphs
Frequency Distribution Graphs
The most common forms of graphs of a frequency distribution are
Line Frequency Graph
Histogram
Frequency Polygon
Frequency Curve
Ogive or Cumulative Frequency Curve
Line Frequency Graph – Used for Discrete Series where variables are measured on
the X – axis and frequency on the Y -axis.
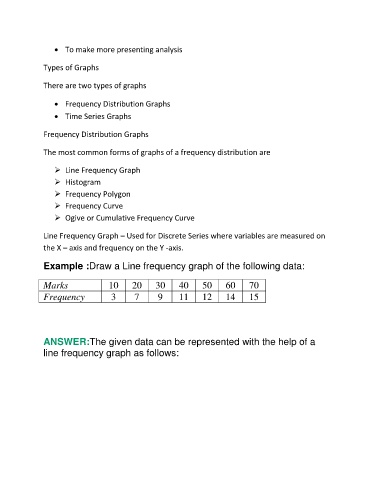
Example :Draw a Line frequency graph of the following data:
Marks 10 20 30 40 50 60 70
Frequency 3 7 9 11 12 14 15
ANSWER:The given data can be represented with the help of a
line frequency graph as follows: