Page 6 - LN
P. 6

Inclusive class Intervals

               Example


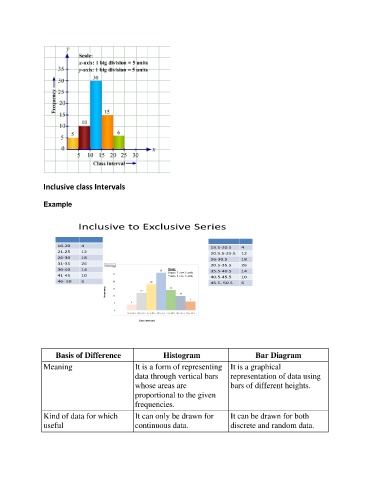
                           Inclusive to Exclusive Series


                    16-20   4                                          15.5-20.5  4
                    21-25   12
                                                                       20.5.5-25.5  12
                    26-30   18
                                                                       26-30.5   18
                    31-35   26                                         30.5-35.5  26
                    36-40   14                                         35.5-40.5  14
                    41-45   10
                                                                       40.5-45.5  10
                    46- 50  6
                                                                       45.5- 50.5  6


                   Basis of Difference                 Histogram                      Bar Diagram

               Meaning                        It is a form of representing  It is a graphical
                                              data through vertical bars     representation of data using
                                              whose areas are                bars of different heights.
                                              proportional to the given
                                              frequencies.

               Kind of data for which         It can only be drawn for       It can be drawn for both
               useful                         continuous data.               discrete and random data.
   1   2   3   4   5   6   7