
Page 4 - LN
P. 4
Multiple bar Diagram
The diagram is used, when we have to make comparison between two or more
variables like income and expenditure, import and export for different years,
marks obtained in different subjects in different classes, etc
It is also known as Compound Bar Diagram.
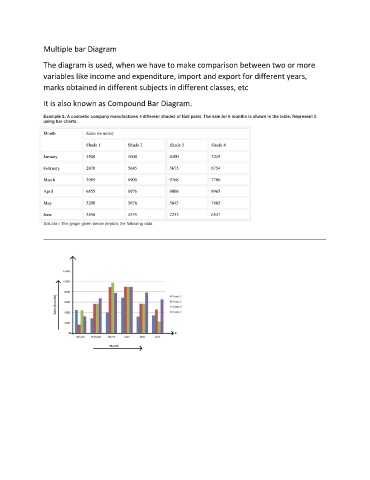
Example 2: A cosmetic company manufactures 4 different shades of Nail paint. The sale for 6 months is shown in the table. Represent it
using bar charts.
Month Sales (in units)
Shade 1 Shade 2 Shade 3 Shade 4
January 4500 1600 4400 3245
February 2870 5645 5675 6754
March 3985 8900 9768 7786
April 6855 8976 9008 8965
May 3200 5678 5643 7865
June 3456 4555 2233 6547
Solution: The graph given below depicts the following data