
Page 3 - LN
P. 3
These diagrams depict only one characteristics of the data, like figures of sales,
population etc.
Heigh of the bar reads the magnitude of the data.
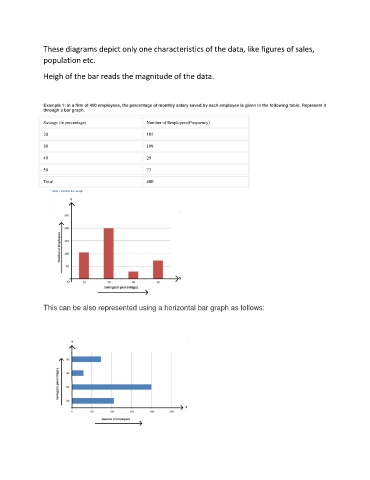
Example 1: In a firm of 400 employees, the percentage of monthly salary saved by each employee is given in the following table. Represent it
through a bar graph.
Savings (in percentage) Number of Employees(Frequency)
20 105
30 199
40 29
50 73
Total 400
This can be also represented using a horizontal bar graph as follows: