
Page 4 - WS
P. 4
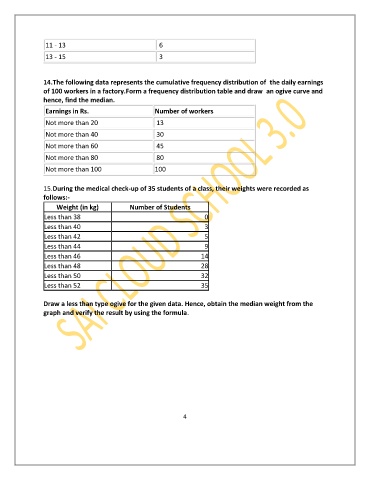
11 - 13                               6
                13 - 15                               3


               14.The following data represents the cumulative frequency distribution of  the daily earnings
               of 100 workers in a factory.Form a frequency distribution table and draw  an ogive curve and
               hence, find the median.
                Earnings in Rs.                     Number of workers

                Not more than 20                     13
                Not more than 40                     30

                Not more than 60                     45
                Not more than 80                     80
                Not more than 100                   100

               15.During the medical check-up of 35 students of a class, their weights were recorded as
               follows:-
                    Weight (in kg)          Number of Students
                Less than 38                                         0
                Less than 40                                         3
                Less than 42                                         5
                Less than 44                                         9
                Less than 46                                        14
                Less than 48                                        28
                Less than 50                                        32
                Less than 52                                        35


               Draw a less than type ogive for the given data. Hence, obtain the median weight from the
               graph and verify the result by using the formula.


                                                              4