Page 3 - WS
P. 3

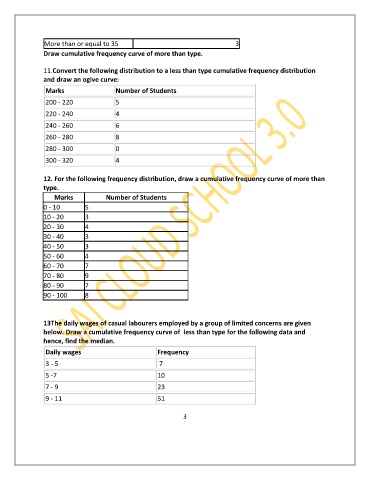
More than or equal to 35                                       3
               Draw cumulative frequency curve of more than type.


               11.Convert the following distribution to a less than type cumulative frequency distribution
               and draw an ogive curve:
                Marks                  Number of Students
                200 - 220              5

                220 - 240              4
                240 - 260              6

                260 - 280              8
                280 - 300              0
                300 - 320              4

               12. For the following frequency distribution, draw a cumulative frequency curve of more than
               type.
                   Marks            Number of Students
               0 - 10        5
               10 - 20       3
               20 - 30       4
               30 - 40       3
               40 - 50       3
               50 - 60       4
               60 - 70       7
               70 - 80       9
               80 - 90       7
               90 - 100      8


               13The daily wages of casual labourers employed by a group of limited concerns are given
               below. Draw a cumulative frequency curve of  less than type for the following data and
               hence, find the median.
                Daily wages                          Frequency
                3 - 5                                 7

                5 -7                                 10
                7 - 9                                23

                9 - 11                               51

                                                              3
   1   2   3   4