
Page 8 - PPT-Tally chart and frequency table
P. 8
Example of Data Handling:
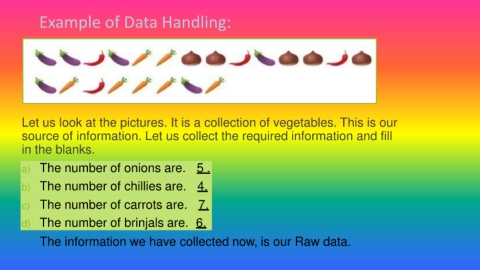
Let us look at the pictures. It is a collection of vegetables. This is our
source of information. Let us collect the required information and fill
in the blanks.
a) The number of onions are. 5 .
b) The number of chillies are. 4.
c) The number of carrots are. 7.
d) The number of brinjals are. 6.
The information we have collected now, is our Raw data.