
Page 10 - PPT-Tally chart and frequency table
P. 10
Tally Chart
▶Let us organise the data to
make it more useful.
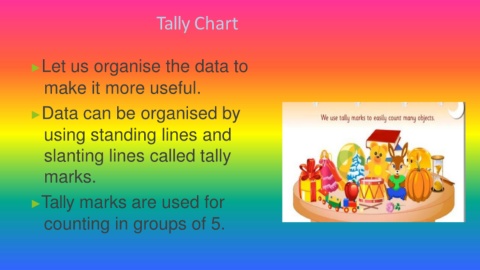
▶Data can be organised by
using standing lines and
slanting lines called tally
marks.
▶Tally marks are used for
counting in groups of 5.