
Page 2 - LN-Tally chart and frequency table
P. 2
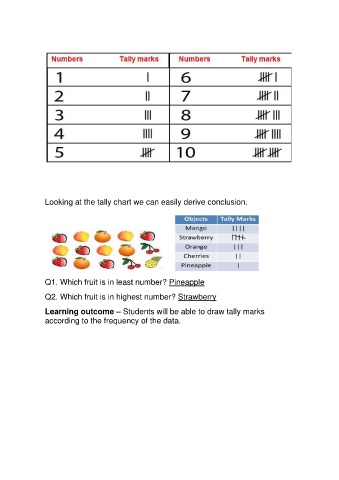
Looking at the tally chart we can easily derive conclusion.


                 Q1. Which fruit is in least number? Pineapple

                 Q2. Which fruit is in highest number? Strawberry

                 Learning outcome – Students will be able to draw tally marks
                 according to the frequency of the data.