
Page 3 - Class VI Activities Forces and Energy
P. 3
Subtopic: 3.3 Movement in space
Ac+vity: Planet speeds
Learning Objec+ve:- Students will be able to construct and interpret a bar graph to show how a
planet’s orbital speed changes with its distance from the Sun.
Materials required:- Ruler, Graph paper, Pencil and eraser, Coloured pencils (op)onal), Planet
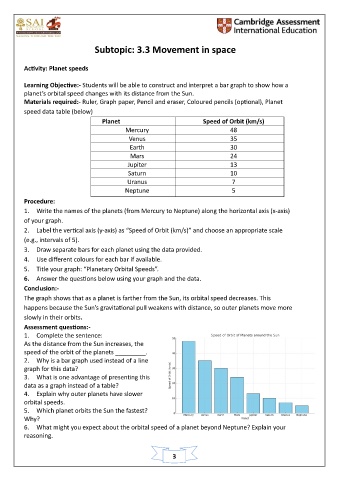
speed data table (below)
Planet Speed of Orbit (km/s)
Mercury 48
Venus 35
Earth 30
Mars 24
Jupiter 13
Saturn 10
Uranus 7
Neptune 5
Procedure:
1. Write the names of the planets (from Mercury to Neptune) along the horizontal axis (x-axis)
of your graph.
2. Label the ver)cal axis (y-axis) as “Speed of Orbit (km/s)” and choose an appropriate scale
(e.g., intervals of 5).
3. Draw separate bars for each planet using the data provided.
4. Use different colours for each bar if available.
5. Title your graph: “Planetary Orbital Speeds”.
6. Answer the ques)ons below using your graph and the data.
Conclusion:-
The graph shows that as a planet is farther from the Sun, its orbital speed decreases. This
happens because the Sun’s gravita)onal pull weakens with distance, so outer planets move more
slowly in their orbits.
Assessment ques+ons:-
1. Complete the sentence:
As the distance from the Sun increases, the
speed of the orbit of the planets _________.
2. Why is a bar graph used instead of a line
graph for this data?
3. What is one advantage of presen)ng this
data as a graph instead of a table?
4. Explain why outer planets have slower
orbital speeds.
5. Which planet orbits the Sun the fastest?
Why?
6. What might you expect about the orbital speed of a planet beyond Neptune? Explain your
reasoning.
3