
Page 5 - Home assignment-correlation analysis.
P. 5
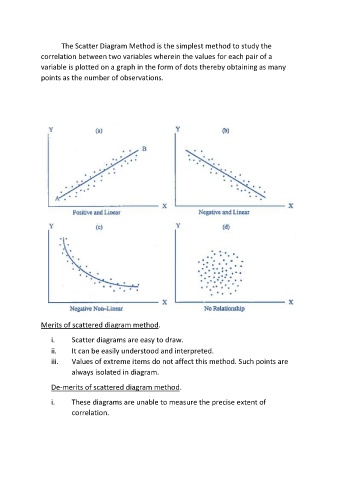
The Scatter Diagram Method is the simplest method to study the

               correlation between two variables wherein the values for each pair of a
               variable is plotted on a graph in the form of dots thereby obtaining as many
               points as the number of observations.


               Merits of scattered diagram method.


                   i.     Scatter diagrams are easy to draw.
                   ii.    It can be easily understood and interpreted.
                   iii.   Values of extreme items do not affect this method. Such points are

                          always isolated in diagram.

                   De-merits of scattered diagram method.

                   i.     These diagrams are unable to measure the precise extent of

                          correlation.