
Page 4 - Home assignment-correlation analysis.
P. 4
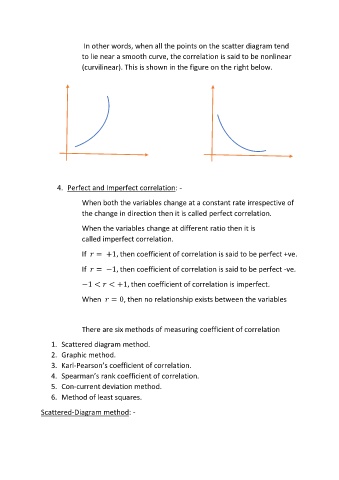
In other words, when all the points on the scatter diagram tend

                              to lie near a smooth curve, the correlation is said to be nonlinear
                              (curvilinear). This is shown in the figure on the right below.


                            Y                                                 Y


                                                       X                                                 X
                    O      Non-linear positive correlation              O     Non-linear negative correlation


                     4.  Perfect and Imperfect correlation: -


                              When both the variables change at a constant rate irrespective of
                              the change in direction then it is called perfect correlation.

                              When the variables change at different ratio then it is

                              called imperfect correlation.

                              If     = +1, then coefficient of correlation is said to be perfect +ve.

                              If     = −1, then coefficient of correlation is said to be perfect -ve.


                              −1 <    < +1, then coefficient of correlation is imperfect.

                              When     = 0, then no relationship exists between the variables


                              There are six methods of measuring coefficient of correlation

                   1.  Scattered diagram method.
                   2.  Graphic method.
                   3.  Karl-Pearson’s coefficient of correlation.

                   4.  Spearman’s rank coefficient of correlation.
                   5.  Con-current deviation method.
                   6.  Method of least squares.


               Scattered-Diagram method: -